
- Thank you received: 0
"Draw" when running in pure command-line Linux
6 years 2 months ago #1802
by jfk68
"Draw" when running in pure command-line Linux was created by jfk68
Hi,
does anybody know some python tricks how to create mesh-plots when running netgen on a remote server from command-line?
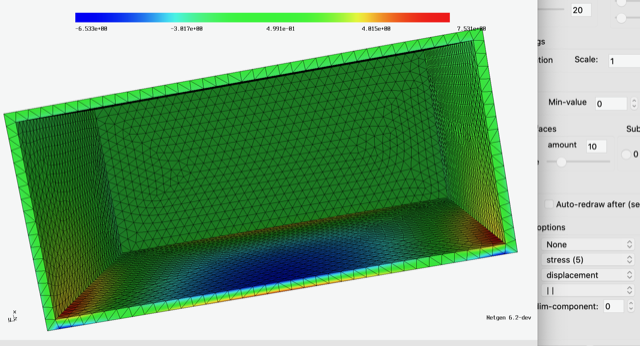
does anybody know some python tricks how to create mesh-plots when running netgen on a remote server from command-line?
Attachments:
- christopher
-
- Offline
- Administrator
-

Less
More
- Thank you received: 101
6 years 1 month ago #1804
by christopher
Replied by christopher on topic "Draw" when running in pure command-line Linux
Sorry at the moment the GUI has to be open to render to an image. This feature is on the wish list, but will most likely be available in our new gui. For the moment you can pickle the solutions you want to save transfer them to your workstation load them and take images there. Its not very convenient, but with a small script it should not be too much effort.
Best
Christopher
Best
Christopher
6 years 1 month ago #1806
by jfk68
Replied by jfk68 on topic "Draw" when running in pure command-line Linux
Hi, thanks for the info.
Lets assume that the output of ngsolve gets stored in some .csv
with x/y/z/stress in each row.
My hope was that some wizard knows how to create some kind of plot plot using some pure python script magic.
CU
Jürgen
Lets assume that the output of ngsolve gets stored in some .csv
with x/y/z/stress in each row.
My hope was that some wizard knows how to create some kind of plot plot using some pure python script magic.
CU
Jürgen
Time to create page: 0.121 seconds